First, what a price actually is
The number on the screen means something much narrower than most people assume: it is the price of the most recent trade. One buyer's bid and one seller's ask met, the matching engine recorded it, and that's the whole story.
Two consequences follow, and everything below is built on them.
First: the price reflects the people willing to trade right now, not everyone who holds the asset. At any moment the overwhelming majority of holders are doing nothing. Price is set at the margin, by the most impatient buyers and sellers. So “someone is selling” and “everyone is selling” are entirely different claims — the first is always true and the second needs evidence.
Second: market capitalisation is not money invested. Market cap is circulating supply multiplied by the last trade price. If a token has one billion units and somebody buys a single unit for ten dollars, market cap becomes ten billion dollars — while ten dollars actually changed hands. “$200 billion was wiped out today” does not mean $200 billion left the market. It means the product of two numbers got smaller. Once that clicks, a “market cap wiped out” headline will no longer rattle you with its sheer size.
A related misconception follows immediately: “someone sold 1,000 coins, so the price should fall”. Whether it falls depends on how thick the other side of the book is. If bids are dense, those 1,000 coins get absorbed level by level and the traded price barely moves; if bids are thin, the same 1,000 can punch through several percent. The size of a sale is meaningless on its own — it only means something next to the depth it hit. The same order in a liquid afternoon and in the thinnest hour of the weekend can produce price effects an order of magnitude apart, which is exactly why so many violent moves happen when volume is lightest. You can check this yourself with the depth and impact estimator against a live order book.
They aren't four competing options. They're four pressures operating on different time scales: supply structure in months and years, macro in weeks and months, leverage and sentiment in hours and days, structural events whenever they happen. A real move is usually one layer supplying the direction and another supplying the magnitude.
Layer 1: supply and demand structure (months to years)
How it works
This layer answers a background question: on a day when nothing in particular happens, what is the baseline level of selling and buying pressure? Three parts make it up.
New issuance. New bitcoin enters circulation only through mining. We're currently in the fourth halving epoch (since block height 840,000 on 20 April 2024), with a block reward of 3.125 BTC and a target interval of about ten minutes — roughly 450 BTC per day. Miners have electricity and hardware costs, and some portion of that output is sold regardless of price. That's a continuous, price-insensitive stream of supply. For other tokens, issuance also includes scheduled unlocks for teams and early investors, and those schedules are normally public.
Long-term holder behaviour. On-chain analysis commonly classifies addresses holding for more than roughly 155 days as long-term holders. They mostly sit out the market, but they tend to distribute in tranches after large advances and accumulate during long quiet stretches. They move slowly and they move a lot — the thickest part of the supply side.
Exchange balances. Only coins sitting on an exchange can be sold immediately. The medium-term trend in exchange-held balances is therefore used as a rough proxy for “supply available for sale”.
How to tell this layer is at work
- Time signature. This layer produces slow drift, not spikes. Weeks of steady grinding in one direction with no single dramatic candle is its shape.
- Where to look. Block rewards and issuance progress on any public block explorer; token unlock schedules in project documentation; exchange balance trends on the free charts of on-chain data platforms.
- Disqualifier. If the price fell 8% in twenty minutes, this layer is almost certainly not the cause. Miners and long-term holders do not change behaviour in unison inside twenty minutes.
When it stops working
On a violently volatile day, this layer explains almost nothing. About 450 BTC of new supply per day is a small number against the billions of dollars of daily turnover on major venues. It sets the long-run water level, not the height of today's wave. Explaining an intraday crash with “miner selling” is usually a scale mismatch.
Layer 2: macro conditions (weeks to months)
How it works
Most of the time, global capital treats crypto as a risk asset. Risk assets share a common environment, and the variable cited most often is interest rates.
The transmission runs roughly like this: a central bank adjusts its policy rate; risk-free yields move with it; the opportunity cost of holding something that pays no yield changes; the relative attractiveness of asset classes is repriced; and money redistributes between equities, bonds, gold and crypto. The Federal Reserve uses open market operations to keep the federal funds rate inside the target range set by the Federal Open Market Committee, and that toolkit is documented on the Fed's own site.

Besides rates, this layer includes the dollar (most crypto is quoted in dollars, so a stronger dollar mechanically depresses dollar-denominated prices) and general risk appetite (equities, and technology stocks in particular, often move with crypto).
How to tell this layer is at work
- Look sideways. This is the single most effective move available to you. Pull up the same window for equity indices, gold and the dollar. If crypto is falling while tech stocks fall and the dollar rises, this is almost certainly not a crypto-industry story.
- Check the clock. Macro releases — rate decisions, inflation prints, employment data — are scheduled in advance. If the move begins precisely at a release time, macro is a strong suspect.
- Where to look. Central bank policy statements and rate history on official sites; any public economic calendar. None of it costs money.
When it stops working
The correlation is not a constant. The relationship between crypto and equities has been tight in some periods, close to nonexistent in others, and occasionally inverted. So “macro drives everything” and “crypto trades on its own” are both oversimplifications — the accurate statement is that this layer's explanatory power itself varies and has to be re-verified each time. When crypto generates its own major event (a platform failure, a protocol exploit, a regulatory shock), this layer gets temporarily overwhelmed. The transmission path and its failure modes are covered in Fed rates and bitcoin.
Layer 3: leverage and sentiment (hours to days)
How it works
This is the layer that turns small moves into large ones, and it's the most common immediate cause of dramatic intraday action.
Perpetual futures let a trader hold a notional position several times their margin. When an account's margin ratio breaches the maintenance requirement, the exchange force-closes the position — and a forced close pushes in the same direction as the move that triggered it: liquidating a long means the system sells on that trader's behalf, that sell order pushes the price lower, and the next tier of longs hits its liquidation level. That's a cascade; the mechanics are in how liquidation cascades amplify moves.
Three public indicators measure this layer:
- Open interest. The total notional value of unclosed contracts — a direct reading of how much leverage has accumulated. The higher it is, the more fuel exists for a reversal to burn.
- Funding rate. The periodic payment between longs and shorts on perpetuals, settled every eight hours on most major contracts. Persistently positive means longs are crowded and willing to pay to stay. It measures crowding, not correctness.
- Liquidation data. The notional value and number of accounts force-closed over a period.
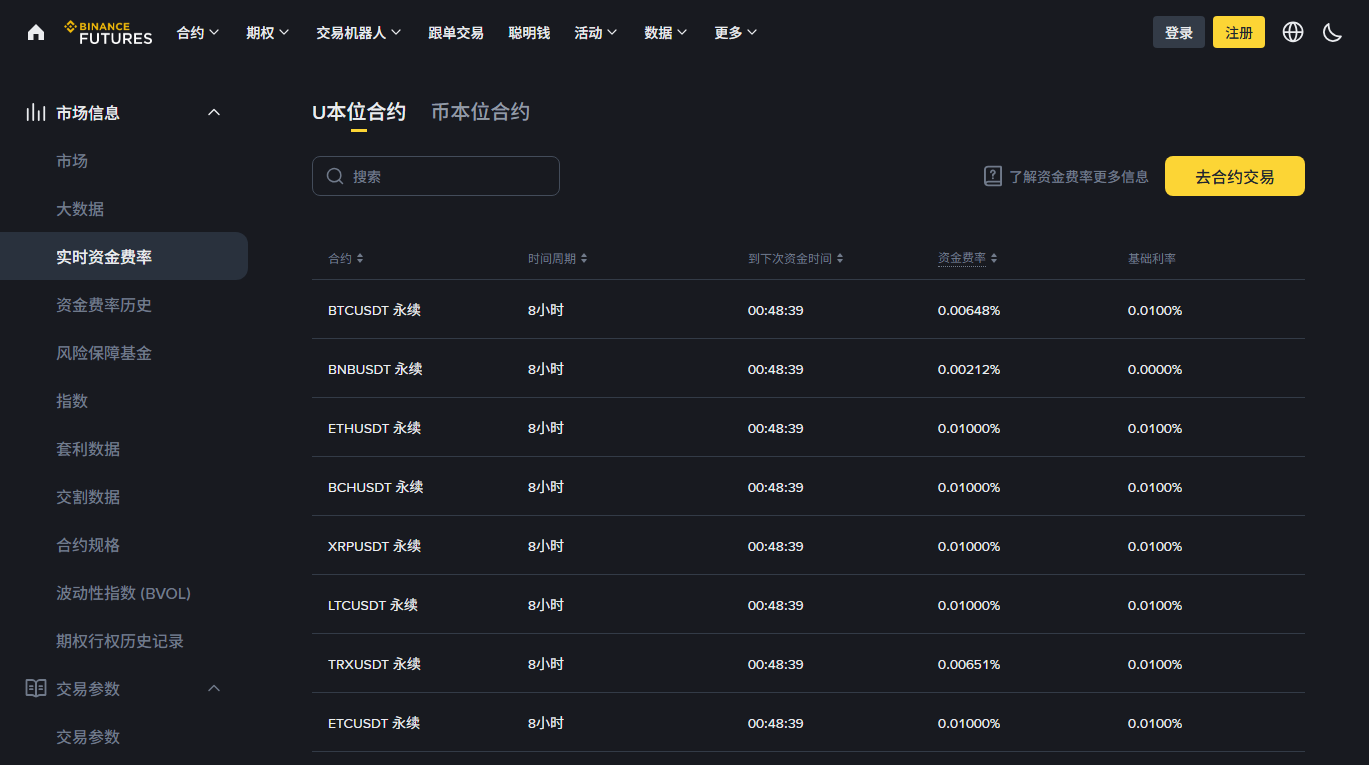
All three are available on free pages at several third-party dashboards. Public liquidation dashboards usually list the market-wide amount liquidated over the past 24 hours alongside the number of accounts closed out; take the figures as whatever the dashboard shows when you open it. What matters more is that the long and short sides are often markedly asymmetric — which side took the damage is itself a piece of information. These figures are aggregated from various platforms' public endpoints with methodologies that differ by site; treat them as orders of magnitude rather than an exact ledger.
How to tell this layer is at work
- Shape. A vertical drop inside a few minutes, a burst of volume, and a visible bounce afterwards — that's the classic signature. A slow grind is not.
- Cross-check. Open interest elevated before the move and sharply lower after it, plus a spike in liquidations over the same window. Both together make this layer a strong explanation.
- Direction check. Look at whether longs or shorts took the damage. Heavy long liquidations correspond to accelerated selling; heavy short liquidations to accelerated buying.
When it stops working
Leverage is an amplifier, not an engine. It essentially never manufactures a direction on its own — something has to push first (it can come from any layer, or simply be a large market order), and only then does leverage magnify it. So “it fell because of liquidations” is an incomplete sentence; the complete version is “an initial decline triggered forced selling, which multiplied the decline several times over”. And when leverage in the system is low to begin with, the same initial push produces no chain reaction at all and this layer goes quiet.
Layer 4: structural events (whenever)
How it works
This layer is exogenous. It doesn't change today's balance of buyers and sellers; it changes the rules, the plumbing, or who is in the market at all. Four common kinds:
- Protocol events. The bitcoin halving changes the rate of new issuance every 210,000 blocks, roughly every four years. It is scheduled, and everybody has known about it for years — a fact that matters enormously; see what the halving is and what actually happened each time.
- Capital-plumbing events. Spot ETFs changed how traditional money can get exposure. US spot bitcoin ETFs were approved and began trading in January 2024; spot ether ETFs began trading in July 2024. Their creation and redemption data is quoted constantly, and the meaning of “net inflows” is routinely misread; see how ETFs actually affect the price.
- Regulatory and policy events. A jurisdiction changes the rules for trading, custody or taxation, which changes who can participate and how.
- Platform and large-transfer events. An exchange or large institution runs into trouble (withdrawals halted, investigation, bankruptcy), or a large on-chain transfer appears. The second of those shows you far less than people assume; see are whales really dumping.
How to tell this layer is at work
- It traces back to a specific, verifiable document or record — with a timestamp and a primary source (a regulator's filing, a platform's official notice, a block explorer entry), not “sources say”.
- The start of the move lines up with that timestamp. A gap of several hours or more should make you doubt the causal link.
- The effect is structural: it changed some longer-run condition, not just the mood of an afternoon.
When it stops working
An event that was fully expected often has no effect on the day it lands — because the price already contains it. Halving dates are computable years ahead; ETF decisions are debated for months before the deadline. The influence of such events tends to occur while the expectation forms, not at the moment of confirmation, and prices sometimes move in the opposite direction once the uncertainty resolves. That phenomenon deserves its own article: why the price already moved before you saw the news.
Putting them together: the reading order
When you're facing a move you can't explain, work through this order rather than starting with a news search.
-
Is the whole market moving together?
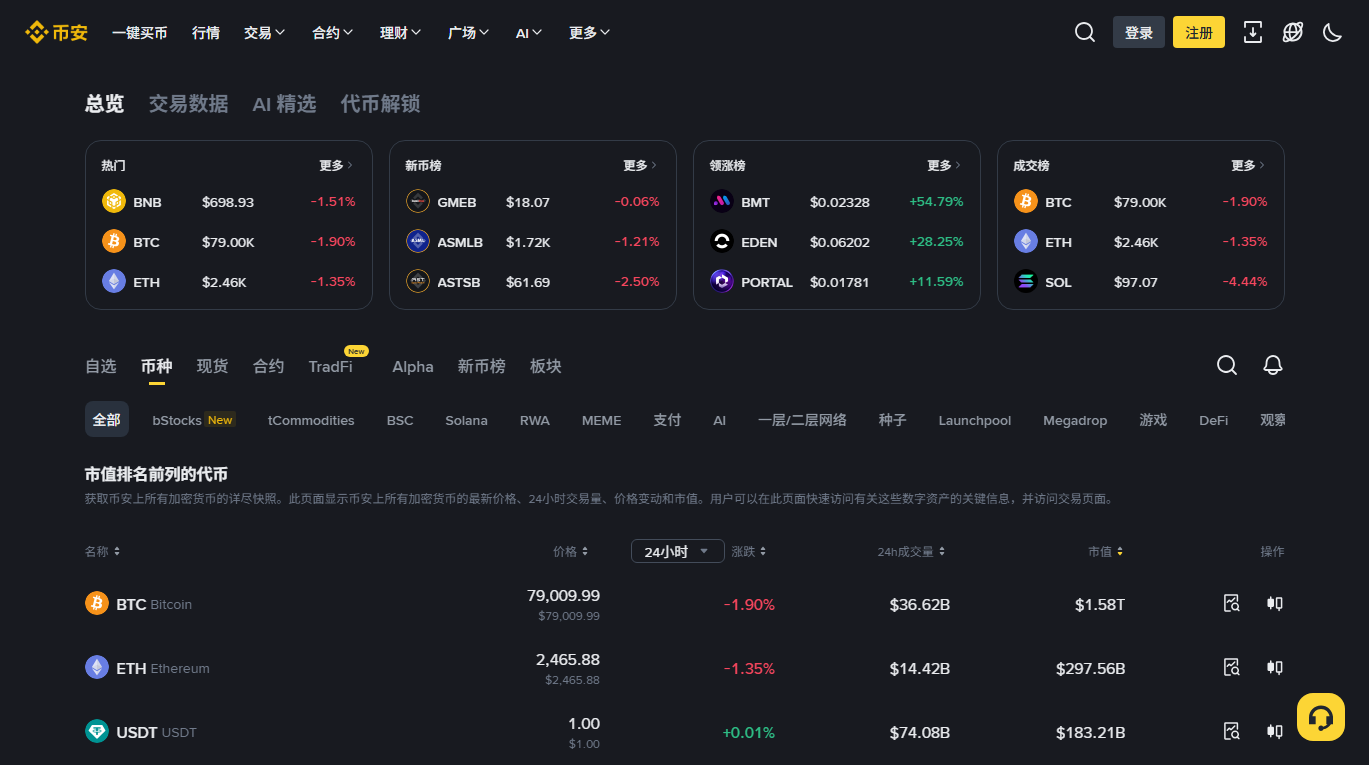
Open a market overview page and see whether the majors are moving as a group. If BTC, ETH, SOL and BNB are all moving the same way by similar amounts, this is systemic — go to layer 2 (macro) or layer 3 (leverage). If only one asset is moving, it's that asset's own story — go to layer 4 and look for its specific event.
-
Spike or drift?
A vertical move inside minutes points to layer 3 first. A slow drift over weeks points to layers 1 and 2.
-
What's happening outside crypto?
Equity indices, the dollar, gold over the same window. Moving together points to layer 2; crypto moving alone rules layer 2 out and sends you back to layers 3 and 4.
-
Sentiment comes last
Only when the first three steps turn up no matching flow, no leverage change and no structural event should you reach for “sentiment” — and even then you have to accept that it's a residual, not a cause. Why it can't be used as a cause: why “sentiment improved” explains nothing.
| Layer | Time scale | Typical shape | Public data | Most common misuse |
|---|---|---|---|---|
| Supply structure | Months to years | Slow drift | Block rewards and issuance, unlock schedules, exchange balance trends | Using it to explain an intraday crash (scale mismatch) |
| Macro conditions | Weeks to months | Moves with other risk assets | Policy statements, rate history, economic calendars | Treating it as a constant law and ignoring that correlation breaks |
| Leverage and sentiment | Hours to days | Minute-scale spike, then a bounce | Open interest, funding rates, liquidation totals | Mistaking the amplifier for the engine |
| Structural events | Whenever | A jump you can match to a timestamp | Regulatory filings, platform notices, block explorers, ETF disclosures | Forgetting it was already expected, and treating the landing as new information |
The other articles that open each layer up are listed under all articles. To look up the indicators for a specific layer, use the layer explorer. If what you're holding is a specific piece of news, the news impact classifier is faster. And to check step one in a single glance, use the market heatmap, which computes the alignment score for you.
What this framework can't do
Being honest about the limits matters as much as the method.
One: it does not predict. The four layers tell you which one most likely drove the move that already happened. They say nothing about what comes next. There is no bridge between those two things, and anyone claiming to have one is selling something.
Two: it frequently produces no single answer. Real moves are often several layers stacked, and their relative weights can't be cleanly separated. “This one isn't clear” is a legitimate, honest conclusion and beats inventing a cause.
Three: after-the-fact attribution is inherently unfalsifiable. The move is over; any self-consistent story can be written. That's exactly why this article insists on reading the data shape first and looking for explanations second — the shape and the data existed while the move happened, whereas explanations get added afterwards.
Where this framework comes from, and what this site is for, is on the about page.
Four: the public data has methodology problems of its own. Liquidation figures are aggregated from various platforms' endpoints and defined differently by each site; on-chain metrics rest on assumptions about address clustering. They can give you magnitude and direction. They cannot give you precision.
Common questions
Which layer matters most?
There's no fixed answer, which is precisely why they're separated. The same layer's explanatory power varies enormously between periods: when leverage in the system is low, layer 3 barely operates; when the correlation with equities weakens, layer 2 loses force. Re-verify every time rather than reusing last month's conclusion.
Why won't you just tell me why it fell today?
Because “today” makes a page useless three days later, and because any specific same-day attribution is unverifiable. Our approach is to write down the reading order so you can run it on any day. For the version aimed at an active sell-off, see why is crypto crashing today.
If I know the cause, can I work out whether to buy or sell?
No, and this site doesn't make that kind of judgement. Between understanding a mechanism and making a trading decision sit your risk tolerance, your time horizon and your position sizing — none of which we know or assess. Our boundary is “now you know why it moved”. Everything past that is yours.
Do I have to pay for this data?
Everything mentioned here is free: block data on public explorers, policy documents on central bank sites, funding rates and open interest on exchanges' public pages, liquidation aggregates on the free tier of third-party dashboards. Paid products mostly add history, granularity and API access — not exclusive truth.
Do the four layers apply to altcoins?
The framework applies; the weights differ. For smaller assets, layer 1 (unlocks, concentration) and layer 3 (thin liquidity, aggressive leverage) are typically amplified, while layer 2 usually transmits indirectly — first into bitcoin, then outward. The specifics are in why altcoins fall harder.