First, confirm the effect is real
Easy to do: open any market overview and put different capitalisation tiers side by side over the same window.
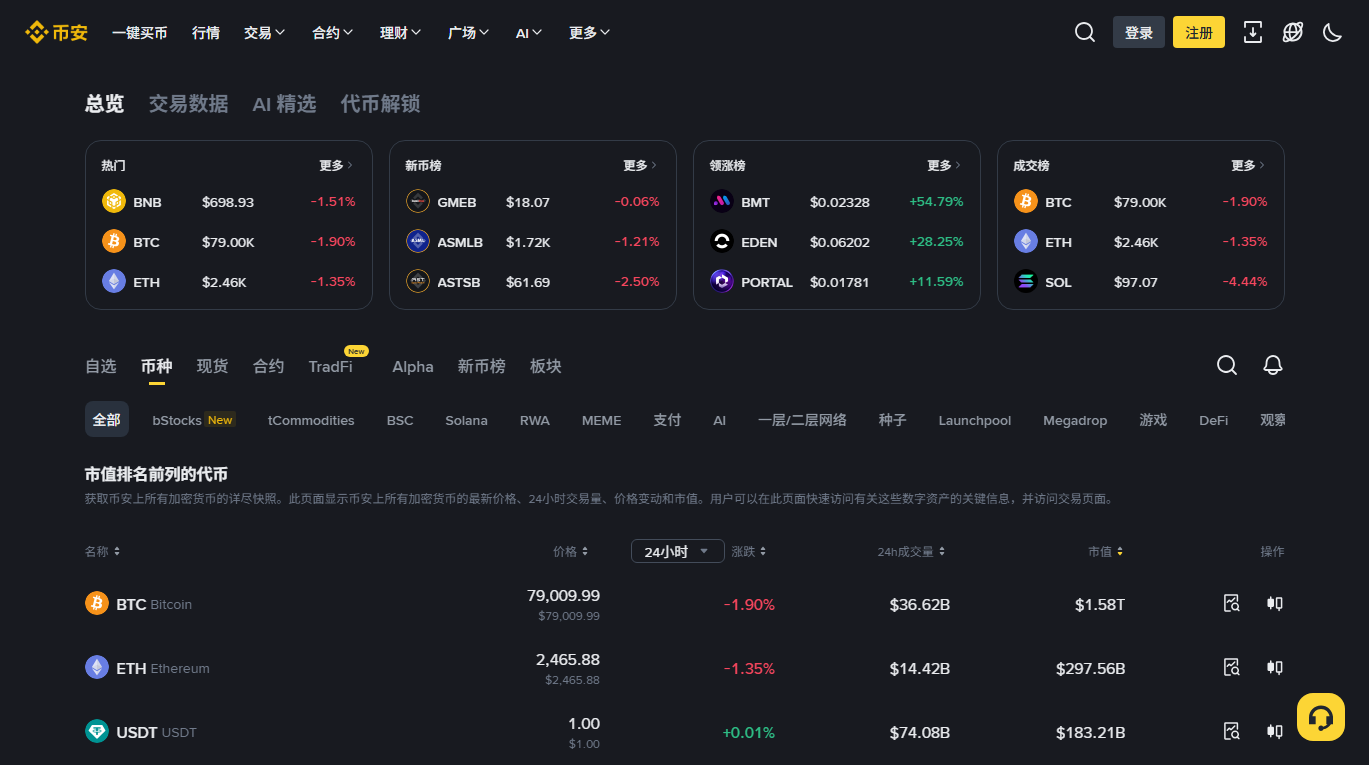
Reason one: book depth differs by an order of magnitude
Price changes happen at the matching engine, and how far a sell order pushes the price depends on how thick the bids beneath it are.
Bitcoin's book on major venues is very deep: a medium-sized market sell consumes a handful of price levels. A small cap's bids can be far sparser, and the same dollar amount can punch straight through several percent. It isn't that the sellers are more aggressive — it's that there are fewer buyers to absorb them.
Worse, the effect reinforces itself under stress: as volatility rises, market makers widen quotes and reduce resting size to control risk, so a book that was already thin gets thinner and subsequent orders of the same size hit harder. You can measure this directly: run the same amount through the depth and impact estimator against BTC and against a small cap, and the difference is immediately visible.
Reason two: capital moves in a sequence
Money entering and leaving this market doesn't spread evenly. It has an order: it arrives into the most liquid assets first, and it leaves by selling whatever can be sold.
When someone needs to reduce exposure and a small cap's depth can't absorb the size, they may sell the liquid part instead; and when risk appetite contracts, capital tends to retreat from the most volatile assets toward the more established ones. Stack those two behaviours and small caps carry disproportionate pressure during declines.
The reverse holds when the market is active: money spilling outward makes small caps rise considerably more than bitcoin. So the accurate statement isn't “altcoins fall more easily” but “altcoin volatility is amplified” — in both directions.
Reason three: leverage ratios and liquidation density
Contracts on smaller assets tend to combine higher volatility, more aggressive leverage use, and thinner depth. Those three together mean liquidation cascades are easier to trigger and travel further: the same initial push moves price more in a thin book, which reaches more liquidation levels.
Mechanism in how liquidation cascades amplify moves. To decide whether that layer is what you're looking at, use the same two tells: a minute-scale vertical drop, and a liquidation spike for that specific asset in the same window.
Two factors unique to smaller assets
1. Scheduled unlocks
Many tokens have lock-ups for teams, investors or ecosystem incentives, and the schedules are normally published in project documentation. A large unlock maturing means a step increase in circulating supply — layer 1 in our framework. Verify it in the project's own documents rather than in community chatter.
2. Holder concentration
If most of the supply sits with a small number of addresses, one participant's behaviour matters far more than it would in a dispersed market. This is exactly why are whales really dumping insists that “bitcoin is hard to manipulate” cannot be transplanted onto every token. The same caveat applies though: the chain shows concentration, not intent.
As an explanatory tool: when something you hold falls more than the market, check these three structural factors before reaching for a conspiracy or hunting for bad news. Most of the time no further explanation is required. This site will not use any of it to tell you what to hold or not hold.
Measure depth yourself: ten minutes, no paid data
All three factors above are checkable. The method is to run the same amount through markets of different depth and compare.
-
Take the mid price
Open any pair's order book; the midpoint of best bid and best ask is your baseline. It beats “last traded price”, which may have been set by a trivially small order.
-
Walk the levels and count how deep you go
For a $500,000 sale, accumulate price × size from the best bid downward until the total is covered. The number of levels consumed is itself a direct reading of depth.
-
Compute the average fill and the slippage
Average fill = total value ÷ total quantity; slippage = how far that sits from mid. Run the identical amount against a small-cap pair and the difference is usually an order of magnitude.
-
Then invert the question
Ask what it would cost to push the price down 1%. That figure is more intuitive than slippage: it tells you directly what order of capital is needed to move this market.
You don't have to do the arithmetic — the depth and impact estimator runs all four steps against a live book, and your input never leaves your browser.
Order books change every second and any tool reads only a limited number of levels. In violent conditions real slippage is usually worse than the calculation — market makers pull quotes exactly when you need the depth. Use it for intuition about magnitude, not as a basis for trading.
Two common misreadings of “rotation”
One: treating rotation as something being directed. “Capital rotated from bitcoin into altcoins” sounds like an actor moving money. It is only a description of something that already happened: small caps outperformed for a while, so it got called rotation. No mechanism guarantees any sequence, and nobody is executing one.
Two: reading “falls harder” as “worse”. The amplification runs both ways — the same structural factors make small caps rise more when the market is active. So the accurate statement isn't “altcoins fall more easily” but “altcoin volatility is systematically amplified”. That sentence contains a magnitude judgement and no quality judgement.
Three specific questions
“If bitcoin rises, do altcoins always follow?” There's no necessary relationship. The direction and speed of rotation vary between phases, and periods where bitcoin rises while most small caps fall do occur. “Rotation” describes what has happened; it is not a dependable rule — and treating a description as a rule is precisely the error this site keeps flagging.
“How do I tell whether a token's depth is good?” Two things: cumulative resting size within a few levels either side of the current price, and the gap between best bid and best ask. Wide spread with sparse orders means poor depth. Definitions and common misreadings are in the glossary. One addition: depth varies by hour — the same pair can be noticeably thinner overnight than during main market hours, so note the time when you measure.
“So should I only hold bitcoin?” Outside our scope — we don't advise on asset selection. This article only explains why volatility differs systematically. How much volatility you're willing to carry depends on circumstances an article cannot decide for you.