If your pulse is up and you're refreshing the price, step away from the screen for two minutes. That isn't wellness advice: decisions made at an emotional peak look worst in hindsight with remarkable consistency. Also, the five steps below take time, and the market isn't going to wait for you to finish either way.
Step 1: does this even need explaining?
Look at the size and the time scale first. Crypto has no daily limits and never closes; a few percent in a day is inside the normal range and needs no reason. If the move sits in that band, the next four steps will probably find nothing — not because you checked badly, but because there was never a single cause.
What's worth pursuing is a decline that is clearly outside the recent norm in magnitude, or that happened very fast.
Step 2: is the whole market moving? (thirty seconds, eliminates half the wrong answers)
Open any market overview and compare the majors over the same window.
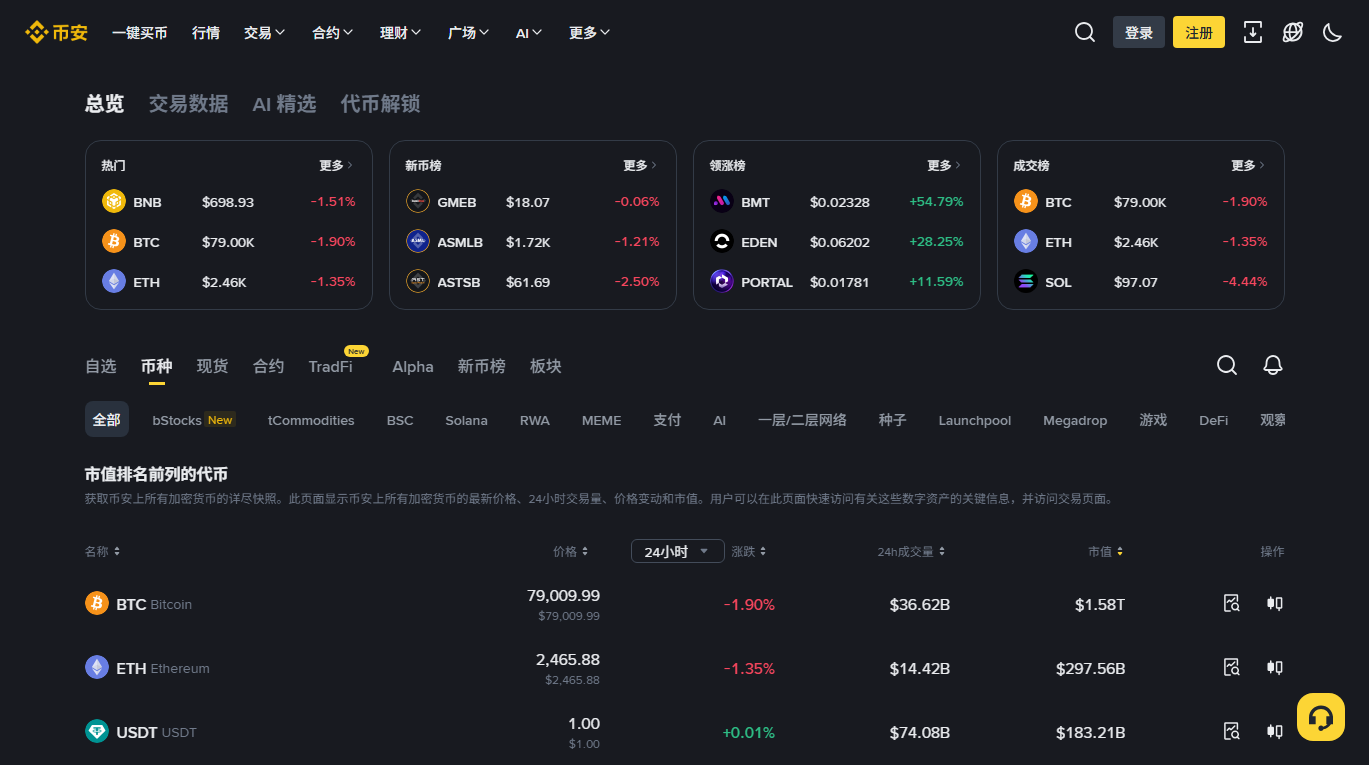
- All moving together, similar magnitudes: systemic pressure. Jump to steps 3 and 4. Do not go looking for news about individual projects — it's wasted time.
- Only the thing you hold is falling: it's that asset's own story. Check its official announcements, unlock schedule, and exchange notices (delistings, leverage changes).
- The market is down and yours is down more: two things stacked. Check the systemic side first, then look at whether its liquidity is thin — smaller assets amplify the same selling pressure; see why altcoins fall harder.
The market heatmap computes the alignment score and tells you which layer to check next.
Step 3: what's happening outside crypto?
Pull up equity indices, the dollar index and gold over the same window. If they moved together, this decline almost certainly didn't start inside crypto.
The usual case is a macro release or policy change altering overall risk appetite, with crypto simply going along. Hunting inside the industry for a culprit (which project blew up, which whale sold) is doomed. Transmission path and failure modes: Fed rates and bitcoin.
Step 4: check leverage and liquidations
If the decline was a minute-scale vertical drop, layer 3 is the prime suspect. Three numbers:
- Total liquidations over the window. A spike confirms that chained forced selling actually occurred.
- The long/short split. Long liquidations far exceeding shorts corresponds to an amplified decline; the reverse is a short squeeze.
- The change in open interest. Read it in contracts or coins first (the notional value shrinks along with the price). A sharp drop after the move means a tranche of positions left the market — some may have been liquidated, others closed by choice; it looks liquidation-driven only when it coincides with a spike in the liquidation total above.
All three are on free pages at several third-party dashboards, and exchanges publish funding rates and open interest themselves — current readings in funding rates and leverage. Remember these are aggregated from different endpoints with different methodologies: read magnitude and direction, don't chase precision.
Step 5: look for a verifiable primary event
Only now do you start reading news, and only news whose primary source you can open:
- A regulator's own site — an announcement or filing with a date and reference.
- An exchange's or project's official announcements page — withdrawals suspended, delisting, security incident.
- A block explorer — an unusual large transfer (remember: you can see the transfer, not the intent).
For what comparable episodes looked like and where the attributions still disagree, browse the volatility timeline. The standard is “attributable, timestamped, and I can open it myself”. “People familiar with the matter” and “analysts believe” do not qualify. If you're holding a specific story, run it through the news impact classifier to see which layer it works through and what it commonly doesn't mean.
How to conclude
| What you see | Most likely | Still to verify |
|---|---|---|
| Whole market down, equities down too | Macro | Whether the move starts at a scheduled release time |
| Minute-scale vertical drop, liquidation spike | Leverage | Long/short split, change in open interest |
| Crypto alone down, official notice exists | Structural event | Whether the notice's timestamp matches the start of the move |
| Weeks of slow decline | Supply structure | Unlock schedules, exchange balance trends |
| None of the above fits | No identifiable driver | — |
That last row isn't a failure — it's the most common result. “No single identifiable driver; within normal variation” is an honest and useful conclusion, because at minimum it stops you installing a fabricated causal link that you'd then carry into the next decision. Why an invented explanation is worse than none: why “sentiment improved” explains nothing.
Common questions
Why does every article I find give a different reason?
Because after-the-fact attribution is unfalsifiable: the move is over, any coherent story can be written, and the writer bears no cost for being wrong. When you find several mutually contradictory explanations, the right response isn't to pick one — it's to notice that none of them may have evidence.
Will it bounce after a crash?
We make no directional judgement. What can be said mechanically: after a cascade ends, prices often recover part of the move because forced selling is involuntary and price-insensitive. That describes a shape that has already occurred; it is not an expectation about the next one.
Should I sell now?
Outside our scope — this site gives no buy or sell advice. The one perspective we can offer is about you rather than the market: if this move is making it hard to work or sleep, the position is too large relative to what you can carry.