Read the alert again before reading anything into it
“Tether Treasury has just minted 1,000,000,000 USDT.” The notification lands in your price app and in three group chats, and the replies all point one way: money is arriving.
The alert itself is usually accurate. What it describes is a single on-chain transaction — the USDT contract on some chain credited a fresh batch of tokens to an address the issuer controls. It tells you the supply changed. It names nobody who took those tokens, and nothing they were spent on. Between “a billion more exist” and “a billion dollars is about to buy bitcoin” sit at least three separate steps, and every one of them can fail.
Supply changes are worth watching. They read far better as a record of where dollars are currently sitting than as a switch wired to price.
How a single USDT reaches the market
Stablecoins live in two markets, and conflating them is where most of the misreading starts.
The primary market is issuance and redemption. A client wires dollars to the issuer and receives the matching amount of USDT. Run it backwards: the client hands USDT back, the issuer pays dollars out, and the returned tokens are burned. Only this step moves the total supply.
The secondary market is everything bought and sold on exchanges and on chain. Buying bitcoin with USDT, or selling bitcoin back into USDT, changes who holds the coins. The total doesn’t budge by one unit.
Getting into the primary market takes some doing. Tether’s published fee page spells out the gate: opening an account that can mint and redeem directly starts with a verification fee in the hundreds of dollars; the minimum per mint or redemption sits on the order of a hundred thousand dollars; the redemption fee is whichever is larger of a fixed floor on the order of a thousand dollars and roughly one tenth of one percent of the amount redeemed (checked September 2026 — the live page governs, since the issuer can revise any of these at will, and only orders of magnitude are quoted here). The parties minting directly, then, are exchanges, market makers, payment firms and institutions; a holder with a few thousand dollars of USDT never comes near that gate. Retail USDT came off the secondary market, essentially all of it.
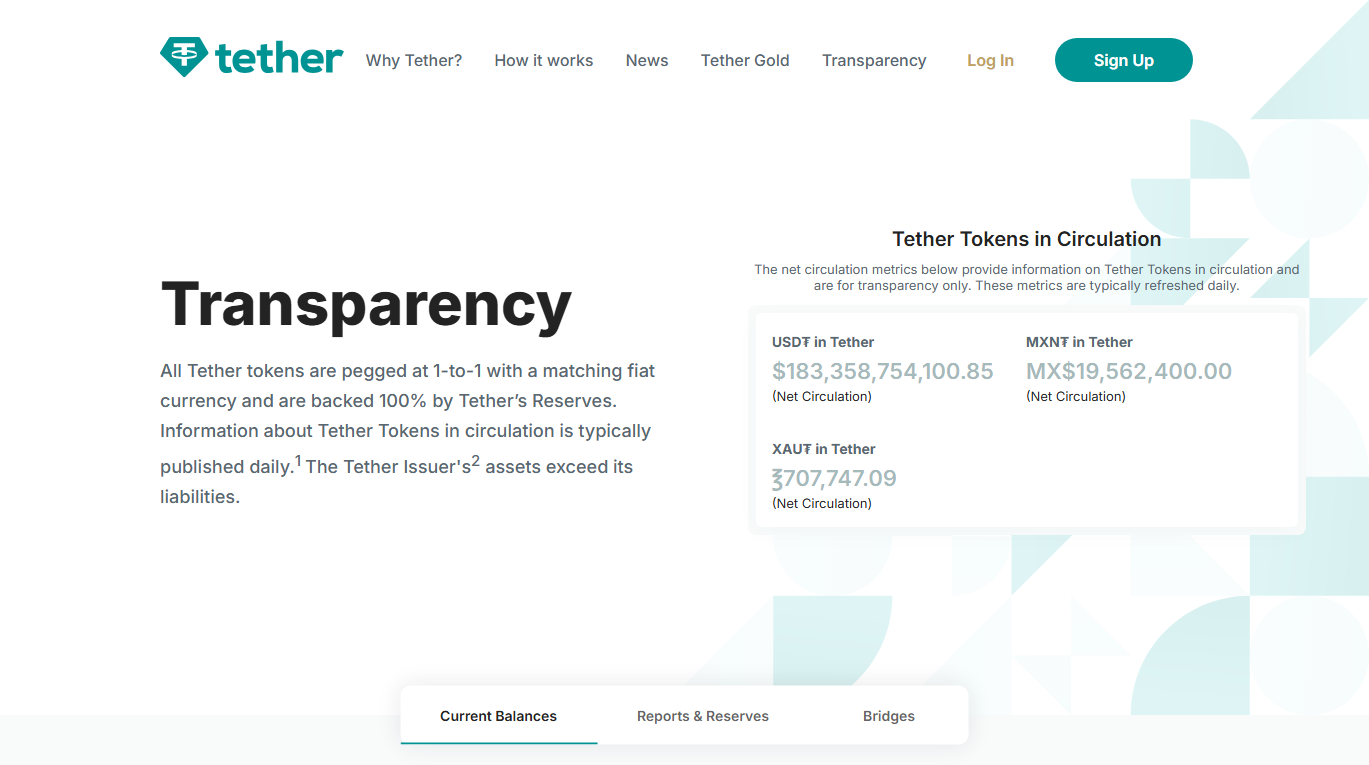
One further detail trips people up: minting on chain and handing tokens over are two different events. The issuer sometimes mints a batch into its own address first, then transfers it out as client subscriptions arrive. An alert catches the minting moment. The net circulation figure on the transparency page has already subtracted whatever still sits with the issuer, so for how much really reached the market, the second number beats the first.
Which way the causation runs
Read the primary-market sequence backwards and the direction falls out of it: somebody needs USDT and wires the dollars first, and the new tokens follow. Issuers don’t scatter coins into the market hoping a buyer shows up.
So where does that demand come from? On exchanges, USDT serves as one of the default quote units. When more people are buying bitcoin, the USDT inventory held by exchanges and market makers gets drawn down, USDT can trade a shade above a dollar on the secondary market, and swapping dollars for fresh tokens at the issuer becomes both profitable and necessary. A great deal of the time the bid comes first and the mint trails behind it, restocking.
Which means a large mint that lands after a price run can look like “minted, then rallied” while being two footprints of one wave of demand, offset in time.
The reverse happens as well — an institution loading the magazine before anything is fired. Supply data on its own will not separate the two cases, and that limitation is the entire reason it makes a poor signal.
Where new USDT can actually end up
Even tokens that genuinely reach the market need not buy anything. Below are the main destinations we keep track of, with the route each one takes to price:
| Destination | Connection to price | Can public data show it? |
|---|---|---|
| Exchange spot balance, to be spent | The most direct bid — but only once an order actually fills | Transfers into an exchange are visible; what happened next is not |
| Futures margin | Runs through the leverage layer, adding longs or shorts indifferently | Open-interest changes offer a sideways check; which side it sits on stays hidden |
| On-chain lending, liquidity pools, yield products | Indirect — mostly shows up in borrowing rates and chain activity | Deposits in the larger protocols are public |
| Cross-border payments, merchant settlement, off-exchange currency swaps | Barely touches crypto-to-crypto trading at all | Hard to tell apart from other transfers on chain |
| Still parked in the issuer’s own address | Hasn’t entered the market yet | Visible, which is the whole argument for reading net circulation |
The last two rows get skipped most often. Stablecoins stopped being purely exchange chips years ago; in parts of the world they are held and sent as a dollar substitute, and bank-hours dollar access matters more to that user than any chart. Demand of that kind lifts the supply total while having no bearing on whether bitcoin closes green today. Row two is the standing reminder that one margin balance opens longs and shorts with equal ease; how the amplifier layer works is laid out in how liquidation cascades amplify moves.
A shrinking supply reads several ways too
The reverse direction hides just as much. A falling stablecoin total can mean money redeemed into dollars and walked out. It can also mean one of these:
Money changing seats between stablecoins. When Silicon Valley Bank failed in March 2023, Circle disclosed that part of the USDC reserve was held there, USDC briefly traded below a dollar on the secondary market, and its supply contracted sharply in the weeks that followed. Over those same weeks, some of that money surfaced in other stablecoins. Watch a single issuer and you conclude the money left; add the majors together and the shrinkage is much smaller.
Issuance halted by a regulator. In February of that year, the New York Department of Financial Services directed Paxos to stop minting new BUSD. From then on the token could be redeemed but never created, and the supply fell month after month. Those declines record an order on paper, not a change in demand.
The steadier habit is to read the aggregate across the major stablecoins. A big swing at one issuer is a lead worth chasing: find out what caused it before drawing anything from it.
Has anyone studied this properly
Yes, and the findings don’t line up neatly. The most-cited paper is Griffin and Shams, “Is Bitcoin Really Untethered?”, published in the Journal of Finance in 2020. It examined USDT flows across 2017 and 2018 and argued that some large flows appeared after price declines and were associated with the price support that came afterwards. Tether has publicly rejected that conclusion.
Two things are worth holding on to with research of this kind. First, what it studied was particular flows, on particular venues, in a particular period; market structure has changed a great deal since then, and the result doesn’t transplant onto this year unaltered. Second, what it reports is an association found inside that window, which neither licenses “a mint means a rally” nor supports “supply and price have nothing to do with each other”. Stretching one paper’s finding into a rule of thumb ranks as the most common misuse of this whole layer.
If you want to watch this yourself
To use stablecoin supply as one reading on macro conditions, work in this order — past the individual alerts, looking at the net change over a stretch of time:
-
Start at the issuer’s net circulation
Open the transparency pages on Tether’s and Circle’s own sites and find the figure labelled net circulation or circulating. Numbers the issuer publishes itself are the closest thing to a primary source available here.
-
Then take the majors together
Third-party dashboards aggregate several issuers across several chains. That saves time, but each dashboard stitches its methodology together differently, so use them for order of magnitude and don’t argue with the official page over the last digit.
-
Line the timeline up in weeks and months
Put the supply total and the price on one axis and ask which of them moved first. If price leads most of the time, the mints look a lot more like consequence. Matching them up hour by hour mostly produces coincidences.
Those three steps get you a rough answer to one question: did fresh dollars enter the stablecoin system over this period? That rules some claims out — “capital is fleeing crypto” sits badly against a stablecoin total that keeps climbing — without telling you why today was red. Checking a story against the numbers works much the same way in net ETF inflows versus new money arriving.
Fed rates and bitcoin follows the price of dollars — the interest rate — on its way into crypto. This page follows the quantity of dollars moving in and out in stablecoin form. The two often move in the same weeks, which makes them easy to blur together, and they remain separate questions.
Common questions
An alert at 2am says a billion USDT was minted. Will the price be up tomorrow?
We don't answer directional questions, and nothing here would support an answer. What the mechanism allows us to say: that batch may still be parked in the issuer's address, it may be restocking against buying that already happened, and it may be headed somewhere with no connection to trading. A single alert carries nowhere near enough information to tell those cases apart.
Is minting USDT just printing money out of thin air?
Under the mechanism the issuer publishes, each new token corresponds to dollars a client wired in, and redemption burns the token and pays the dollars back out. Whether the reserve is full and what it holds are questions for the issuer's periodic reserve reports and attestation-style disclosures. That concerns the issuer's own creditworthiness, which sits apart from whether a mint pushes any price up.
Total stablecoin market value hit a record. What does that tell me?
That more dollars exist in stablecoin form than before. Some of them wait on exchanges for an order, some earn yield on chain, some are moving across borders as payments. The figure describes the state of a pool of money; it says nothing about whether or when that money buys any asset.