What it is
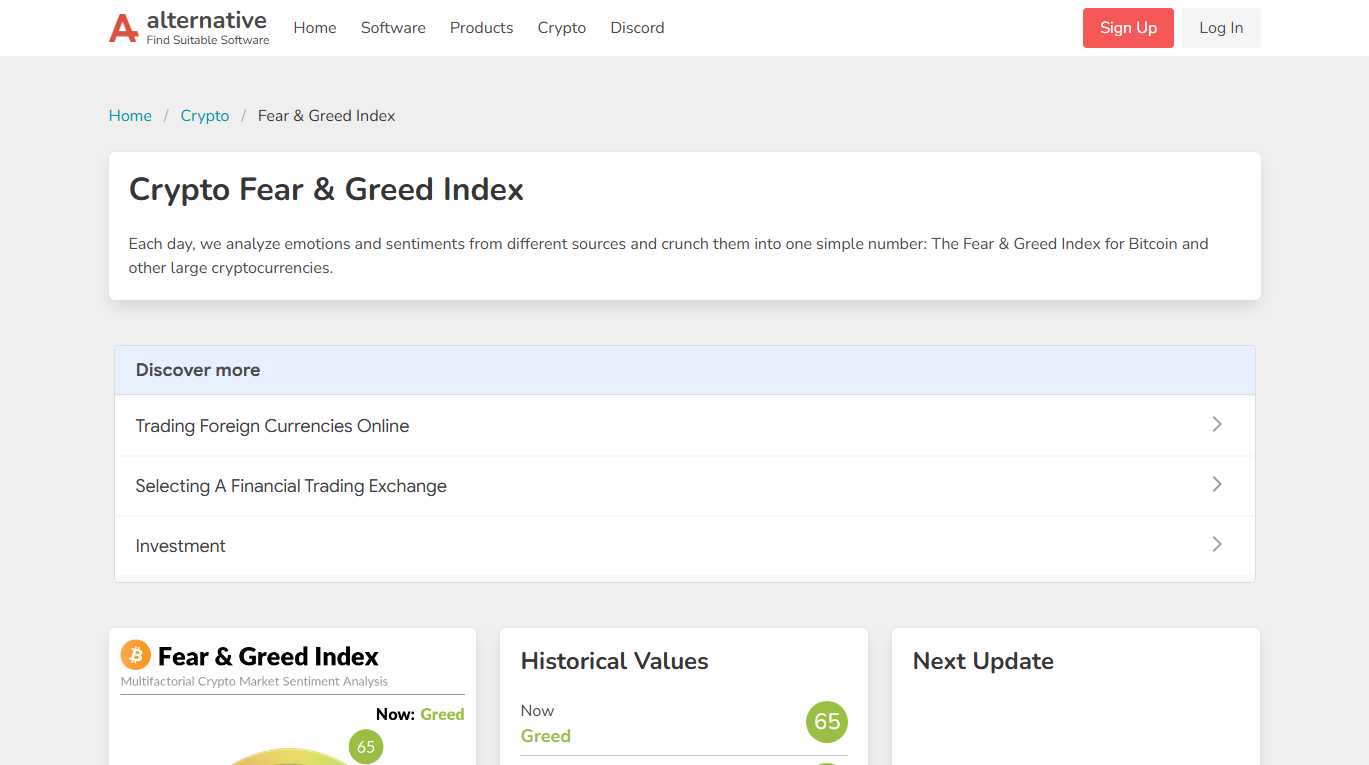
The Crypto Fear & Greed Index is published by a third-party website. It combines several market inputs into a single 0-to-100 reading: low means “fear”, high means “greed”. It updates daily and the page also carries historical values.
Pull the components apart
Per the publisher's own documentation, the index combines several categories of input:
| Component | What it measures | Is it a function of price? |
|---|---|---|
| Volatility | Current volatility against its recent average | Yes — computed directly from the price series |
| Momentum and volume | Recent directional momentum and trading activity | Yes — momentum is entirely determined by price |
| Social media | Post and engagement volume on related topics | Partly independent, but usually follows price |
| Dominance | Bitcoin's share of total market capitalisation | Yes — derived from the prices of all assets |
| Search interest | Search trends for related keywords | Partly independent, and likewise lags price |
| Surveys | Directly asking participants what they think | Relatively independent, but long inactive in practice |
The conclusion is direct: the heaviest-weighted components are all functions of price. Combine them and what you mostly get is another way of stating how price has recently behaved. Which is why using it to explain price goes in a circle — you're explaining price with price.
“Today's decline reflects fear in the market; the index has fallen to 20.” — and the index fell to 20 largely because the price fell. Unfolded, that sentence says “it fell because it fell”. How to spot this family of sentences: why “sentiment improved” explains nothing.
So is it good for anything?
Yes, but not for what most people use it for. Three legitimate uses:
1. A compressed state summary
If you want one number that says roughly “is the market energetic or subdued lately”, it's less effort than checking volatility, volume and momentum separately. Treat it as an indicator lamp on the dashboard, not a diagnostic report on the engine.
2. A mirror for looking at yourself
This may be its most valuable use: compare your current emotional state against the reading. If the index shows extreme fear while you're about to sell immediately, you at least know you're in the same state as most people. That doesn't tell you what to do — but it does tell you your decision isn't being made independently.
3. A rough coordinate for comparing periods
Comparing “how does now feel against three months ago” is more reliable through the index than through memory. Note that its components and weights get revised by the publisher, which reduces comparability across long spans.
The limitations, stated plainly
- It lags. Its inputs are almost entirely price and volume that already happened, so it describes the past, not the present driver.
- It doesn't distinguish causes. The same reading of 15 could come from a macro shock, a liquidation cascade, or a platform failure. The index won't tell you which layer — and that's the thing you actually needed to know.
- It's defined by a single third party. Weights, components and algorithm are the publisher's decisions and can change. There's no industry standard and no independent audit.
- It only covers sentiment, and sentiment is a residual. In this site's four-layer framework, sentiment comes last — it's only reached when the first three layers explain nothing.
- Using it as a trading signal has no foundation. Rules like “buy at extreme fear” always work in retrospective retellings because the cases where they didn't don't get retold. This site offers no judgement of that kind.
Build a more honest sentiment reading yourself
If what you want is a sentiment proxy that is as little contaminated by price as possible, three raw readings beat any composite index, because they measure positions participants actually took and money they actually paid rather than repackaging the price. Two of the three still carry a price factor in their dollar figures, so the table below states how independent each one really is.
| Reading | What it measures | Independent of price? | Where to find it |
|---|---|---|---|
| Funding rate | Which side is paying to hold — how crowded positioning is | Yes (reflects actual payments) | Exchanges' real-time funding pages |
| Open interest | How much leverage has accumulated — the available fuel | Partly: the change in the number of contracts held is not computed from price, but the usual dollar notional figure is contracts times the price at the time, so that layer still carries price in it | Exchanges' derivatives positions data |
| Liquidations and their split | How much was just force-closed, and on which side | Partly: it records force-closures that already executed, but the dollar amount is likewise converted at the price at the time | Free pages on third-party dashboards |
Read together they say far more than any composite: funding tells you which side is crowded, open interest tells you at what scale, and liquidation data tells you whether that side has already been washed out. Current readings are in funding rates and leverage.
They have a hard boundary too: they only cover derivatives participants. They see nothing of spot holders' state of mind and nothing of capital sitting off-exchange. Anything claiming to measure “overall market sentiment” deserves one question first: whose sentiment, exactly?
Three questions
“Does a reading of 10 mean the bottom?” We make no such judgement. Compositionally, a low reading mostly reflects recent falls and expanded volatility — a description of what already happened. Turning a description into a prediction is the move this site refuses, and rules of that kind always hold up in retrospective retellings because the failures don't get retold.
“Is there a better sentiment indicator?” The three above are closer to independent, but they only reflect part of the derivatives market. No single number represents market sentiment — not because the tools are inadequate, but because “market sentiment” isn't a well-defined measurable object in the first place.
“Why do different sites' fear and greed indices disagree?” Because each defines its own algorithm and weights, with no standard and no independent audit. Check who publishes it and whether the method is disclosed; an index whose algorithm you can't inspect is worth less still — you can't even verify what it measures.